
In this blog, we are going to be taking a closer look into a helpful new feature Microsoft is rolling out right now called Productivity Score.
Because of the pandemic and the inevitable demand of working from home, Microsoft is looking for more ways to accommodate companies and their users with valuable tools that ease the experience of end users and controls for IT admins.
However, for business owners, there is still a challenge getting insights into how people are working and collaborating from home. Apart from the Microsoft 365 reports, there wasn’t a real option to have deeper insights on how productive your employees are in their daily activities.
Now with the release of the Productivity Score dashboard, this changes the game and gives you much more ways to drive and improve productivity throughout your business.
Enabling the Productivity Score dashboard
To get started with the Productivity Score, you will first have to enable the feature and wait approximately 24 hours for Microsoft to collect telemetry data from its services.
To get access to the Productivity Score dashboard, you will need to have access to the Reports Reader role or higher.
You can then enable the Productivity Score dashboard by going to https://portal.office.com, then expand the Reports > Productivity Score branch and click on Enable Productivity Score.
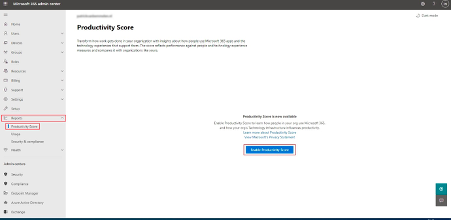
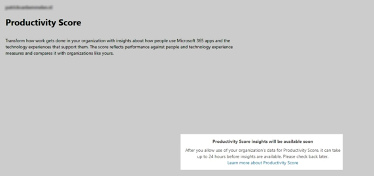
After you’ve enabled the Productivity Score feature, you’ll have to wait for the dashboard to get filled up with information.
Diving into the categories
Once you have collected all the data, your dashboard will be populated, displaying all the different categories that the Productivity Score dashboard looks at.
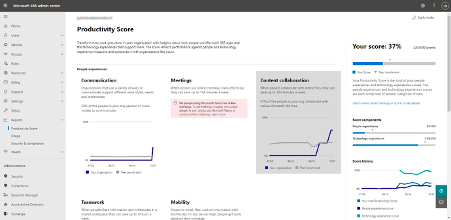
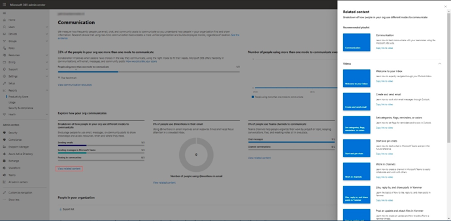
Diving into the categories, you’ll see a breakdown of each category, showcasing useful information on the subject matter. For example, when looking at the Communication category, you will notice that there are a lot of improvements that could be made, such as trimming down email usage across my organization.
To motivate people to collaborate via Teams instead of through email, I could set up a Team inside my Microsoft Teams environment named Tips and Tricks and share links to content that explains to people how they can collaborate more efficiently. You can even view the top users who use email instead of Teams and target your actions on these persons or groups.
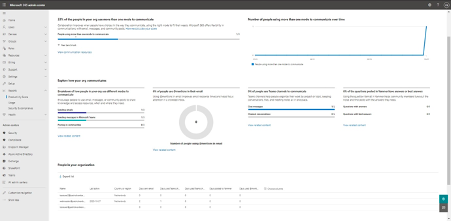
Think it’s hard to find material for that? Well, think again – clicking on View related content will give you links to videos created by Microsoft. You could post these links with a small introduction and view the progress right from the dashboard, measuring progress as you go along.
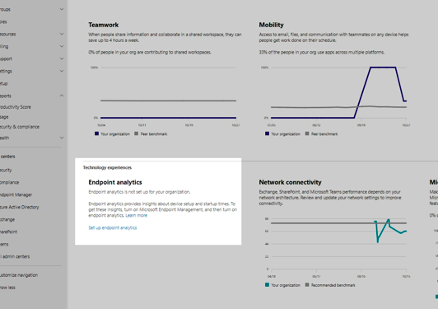
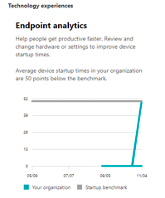
Endpoint analytics
Besides from training and tips you can send to users, there is also a category which is more focused on the endpoint. We determine user experience through the tools we have to our disposal, but also on how our workstations perform. Boot times is one of the factors that can have a real impact on the experience users get while working on their endpoints.
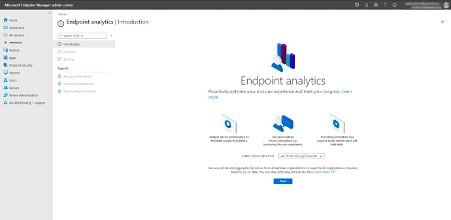
To analyze this endpoint behavior, you can set up Endpoint Analytics in your Endpoint Manager environment.
You can do this by clicking on the Endpoint analytics header, where you’ll then be taken to Endpoint Manager to start the collection of data from your endpoints.
Note: To use Endpoint Analytics, your devices need to be enrolled and licensed for Endpoint Manager.
More details on licensing can be found here.
To start collecting the data, simply click on Start and the collection begins.
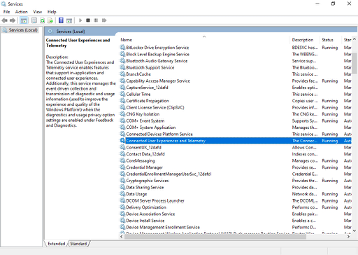
To send data over to the Endpoint analytics workspace, the Connected User Experiences and Telemetry service needs to run on your endpoints. This service is enabled by default, but if you find some endpoints that aren’t sending any data then be sure you check that out first.
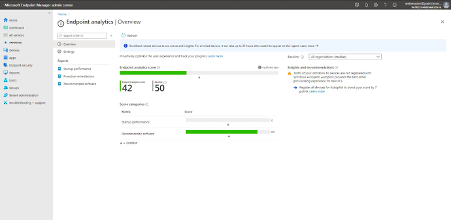
Once your all set, the Endpoint Analytics category will be showing the collected telemetry data from your endpoints, and you can then act upon the generated reports.
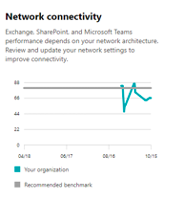
Network Connectivity
Apart from endpoints, there is also another highly important factor when it comes to cloud services, which is network performance.
Network performance should not be overlooked, as it is crucial when it comes to delivering a great user experience.
Microsoft has added this new option to measure the network performance and which Paul Robichaux has written a blog about called Basic network monitoring for Office 365 which you can read here.
This test is a direct part of the Productivity Score dashboard and adds the test results to the overall score.
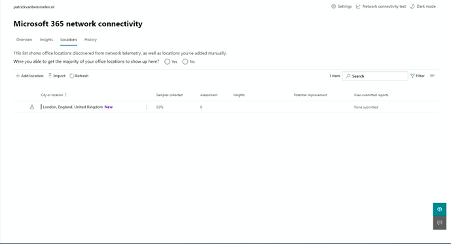
Part of this category is adding (Office) locations and specifying the IP subnets which are being used in the local networks.
To do this, you will need to go into the Locations tab and select Add location.
Next, you will need to enter the address of the location you want to add and the local subnets.
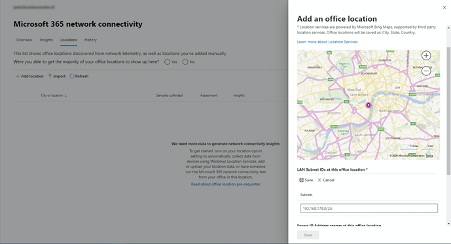
After you’ve finished adding in all the locations, it will start collecting and sorting all the measured performance telemetry data per location so you can have insights on your various Office locations.
Microsoft 365 Apps Health
The last category in the dashboard is M365 Apps Health score.
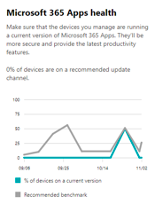
What this does is collect all the active versions of the Microsoft 365 Apps for Business and Enterprise installations.
The installed instances might get outdated over time, which could potentially lead to incompatibilities with add-ons and mean users experience issues which already have been fixed in new releases.
To be sure users get the best experience here you should choose your Update Channel wisely. Microsoft also recommends using the Current Channel or Monthly Enterprise Channel as the preferred channel for your Office installations.
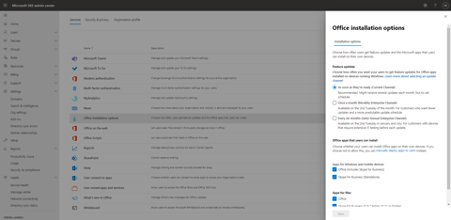
You can change your companies Office Update Channel by expanding the Settings branch, then go to Org settings and select the Office installations option in the presented list.
Final verdict on the Productivity Score Dashboard
As you can see, The Productivity Score dashboard truly does bring insights into how people work to life, delves into how they operate in the Microsoft 365 services and how well the endpoints and networks that they are connected from are performing.
In my opinion, in times where so many of us now rely upon working from home, this will give IT pros and businesses more ways to ensure people are staying productive.
This concludes my first blog for Practical 365. I hope you enjoyed reading this article and if have you any questions, be sure to post them in the comments section below.


Hi Patrick, I agree with you, there’s a great way to improve people productivity. But Microsoft didn’t do it on the right way, they are too much focus on measure quantitative data, and they have this very bad privacy issue. Such score should be 100% private, it’s the only way to build trust and ensure empowering end users. It’s what we did at Collaboration IndeX since 2016 when we launched the platform, our indexes are available to the end user itself, and completely private from managers and IT Teams. This really helps empower people to master digital skills, and this is really useful. Best
This is a complete horror feature that gives Microsoft insights that are way beyond what George Orwell could have imagined!
That they now offer an option to hide personalized data from the company’s network administrators doesn’t change the fact that Microsoft still collects this data.
Absolutely horrendous and a gross violation of your employees’ privacy. Truly disgusting!
I totally agree with that!
Dear “zucht”,
Please take a look at this:
https://docs.microsoft.com/en-us/microsoft-365/admin/productivity/privacy?view=o365-worldwide
Agreed that Microsoft received some criticism about the new feature and has changed the possibilities to opt-out and anonimize collected metrics.
We are not “going by the facts” but review a product as-is.
Of course you are always free to use – or not use – the products in your own manner.
Je gaat voorbij aan het belangrijkste issue: privacy, opt-out en de GDPR.