
Introduction to Basic Networking Monitoring for Office 365
One of the most significant objections heard from customers who don’t want to move to the cloud is simple: “what if my network stops working?” This seems like a fair question since, without a network that can reach Microsoft’s services, you won’t be able to get all that much work done (or even watch Netflix!) Reliable Internet connectivity is critical to many different essential business services, so most of us have some network monitoring in place. The problem with trying to monitor connectivity to a complex service like Microsoft 365 is that there are lots of endpoints to monitor. In our current forced-working-remotely world, your users are likely to disperse into lots of locations that require monitoring.
Note that the feature described here is officially in preview as of November 2020, so it may change at any time.
Microsoft decided to attack this problem differently: they have released the first version of a network monitoring toolset, first announced at Ignite 2019, that uses telemetry from Office desktop clients to report on connectivity between your clients, wherever they are, and the Office 365 “front door” location that the client is connecting to. In Microsoft-speak “front door” refers to the service entry point that a client connects to; one of the primary design goals for what Microsoft refers to as the Microsoft Global Network is to minimize network latency between a client and the front door. Once your Office 365 traffic enters the front door, Microsoft’s private network is supposed to efficiently get the traffic to and from the appropriate Microsoft 365 service resources, wherever they are. (This isn’t as straightforward as you might think because not every region has its own set of M365 services—look for more details on this in a future article).
Basic Network Monitoring for Office 365
The network monitoring tools appear in the Microsoft 365 admin center under the Health section in the left navigation bar. When you click on Network connectivity, you’ll see the connectivity dashboard, which will look something like this once it’s fully populated. How do you get it fully populated? Ah, there’s the question!
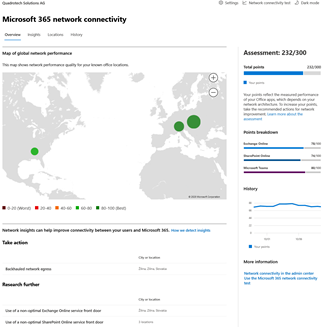
There are two ways to make data appear in this dashboard:
- You or your users can manually run a connectivity test from https://connectivity.office.com/ from a Windows machine.
- Your end-users’ machines can contribute telemetry that the service uses to populate data.
Let’s take a look at each of these alternatives.
Manual connectivity tests
If you choose to manually run the connectivity test, you should first sign in using the link in the upper-right corner of the web page—if you don’t, you’ll still get test results, but they won’t be associated with your tenant. After signing in, you can tell the tester whether you want to allow automatic detection of your location and what domain you’re using, then click the “Run test” button. You’ll see an immediate map of your network connectivity and some basic data about its quality, and you’ll receive a prompt to download and run a small executable that performs some extra tests. The screenshot below will give you an idea of what this looks like:
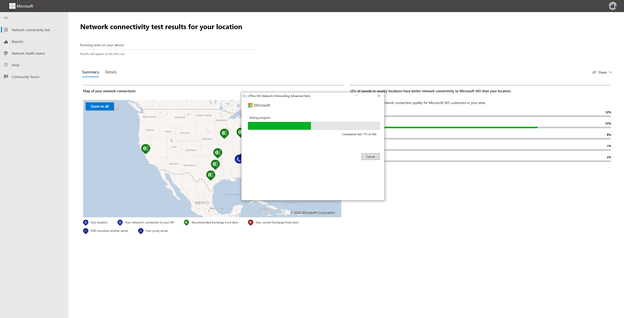
In my tests, this required an upgrade to the .NET Core runtime on about 40% of my test machines; if you need the upgrade, the test executable will tell you. Once you start the executable, it will run more than 350 (as of this writing) connectivity tests covering almost all of the services and endpoints and give you a detailed report. The report contents are described pretty thoroughly in Microsoft’s documentation, so I won’t repeat them here, except to say they will be mostly incomprehensible to everyday users.
As long as you sign in first, those results will both be reported to you but also contributed to the Locations tab of the dashboard— locations that have at least one user-submitted report will show up with a “View results” link that shows a summary similar to this. As an administrator, you can control whether you consider user-submitted results as part of the summary data for a location.
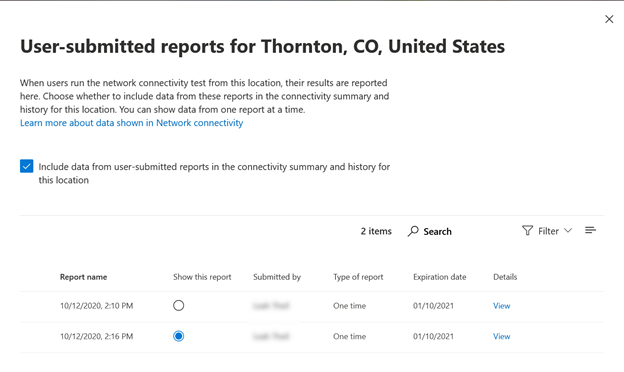
Microsoft says that these user-specific tests provide more depth than the automatically gathered test data, so they are useful for tracing problems reported by a specific user.
Collecting data automatically
Instead of depending on users to manually run tests, you can automatically collect data but only under a specific set of conditions. The first condition is that you will only see data for specific locations known to the tool. How does it know what locations exist? One way is that you can manually add a location by specifying the physical location, the local IP subnets in use at that location, and the public IP addresses used to egress traffic from that location to the Internet. In that case, you need at least two Windows machines in the location running version 20.161 or later of the OneDrive for Business client. The location data you see will be based on the network information you provide when defining the location.
Another way is that you can let the service figure it out based on the client telemetry it sees. In that case, you need at least two Windows machines running version 19.232 or later of the OneDrive for Business client in that location. The Windows machines must have the Windows Location Service enabled, and they must be connected to the Internet using wi-fi. In this mode, all the machines in a single city will be treated as one location, and the location will be blurred to the nearest 300 meter by 300 meter square.
While manual measurements can show up in the admin center after a few minutes, automatically gathered results can take up to 24 hours.
Working with insights
After you’ve started to gather some data, the Insights tab will start to show data; you’ll also see location-specific insights when you view the details for a specific location. Insights include a network map that shows you what front doors are optimal for your location, what front doors you’re actually connecting to, and any weird egress routes that may exist. You’ll also see workload-specific insights, if any exist; for example, my work tenant currently shows me that users in Slovakia and Alabama are both routed to a non-optimal front door for SharePoint traffic.
There are five location-specific insights currently supported (plus one specific to tenants in China):
- Backhauled network egress
- Better performance detected for customers near you
- Use of a non-optimal Exchange Online service front door
- Use of a non-optimal SharePoint Online service front door
- Low download speed from SharePoint front door
In addition, there are tenant-level insights for SharePoint and Exchange Online performance.
The future
Some of the additional data items shown in the portal, such as the average latency for Exchange Online connections, fall into the “fun fact” category; in the majority of cases, it doesn’t matter to your users whether your ExO latency is 28ms or 32ms. However, the insights, such as “you’re connecting to a front door on the other side of the ocean from your location,” are valuable because they can lead you to find and fix networking problems that may lead to poor performance and user complaints. As Microsoft continues to extend this feature to gather more data for more workloads and—more importantly—turn that data into useful insights, I expect the value of this feature to continue to increase.